

Port Delays and Congestion Absorb 5% of Industry’s TEU Capacity
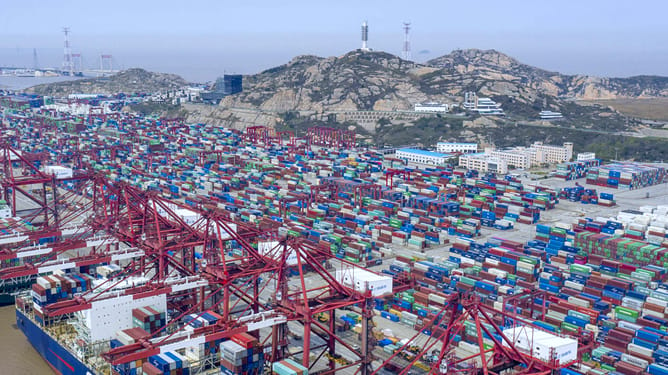
With container carriers continuing to be under pressure, one of the issues that analysts are constantly looking at is the percentage of capacity that is tied up. The analysts at Sea-Intelligence set out to quantify the number to illustrate changes in the market and how it might impact future performance.
Sea-Intelligence highlights that the container shipping industry was quite stable for a decade between 2011 and 2019. During that time, it says, on average, only 2.2 percent of the world's container shipping capacity was tied up by delays. The industry accepted this 2.2 percent rate as a standard part of balancing supply and demand.
“However, following the pandemic, things have changed a lot,” says Alan Murphy, CEO of Sea-Intelligence. “We can use the current global fleet size to calculate how much total cargo space is currently unusable due to vessel delays.”
Global container vessel schedule reliability, Sea-Intelligence points out, remains somewhat stable around 60-65 percent, showing no signs of improvement, and in stark contrast to the 2011-2019 normality of 70-80 percent. Furthermore, it says late vessel arrivals are now settling into 5-5.5 days of delay, up from the pre-pandemic norm of 3-4 days.
“This structural shift to a larger risk of vessel delays, and their longer durations, inexorably leads to a larger share of global capacity being rendered unavailable, as vessels stuck in delays do not move cargo,” says Murphy.
The analyst group Linerlytica further points out that only 89 vessels worldwide are currently inactive, with a capacity of just 142,402 TEU. It calculates that there are more than 5,400 container vessels active worldwide with a capacity of more than 23 million TEU.
Sea-Intelligence calculates that currently a total of 5.0 percent of all global deep-sea capacity is tied up, due to the delays, congestion, and other factors.
“With a 5 percent absorption rate, the global market is ‘missing’ capacity for 1.7 million TEUs from continuous delays,” extrapolates Murphy. “If we look at only the extra 2.8 percent of absorbed capacity above the pre-pandemic baseline level of 2.2 percent, it equals 1.0 million TEUs of absorbed capacity.”
Sea-Intelligence highlights that a capacity of 1.7 million TEUs equates to the size of the 8th largest container shipping company in the entire world. It would be behind Evergreen (2.2 million TEU capacity) in the ranking and almost equal to the total capacity of HMM (1.0 million TEU), the current 8th largest container shipping line.

that matters most
Get the latest maritime news delivered to your inbox daily.
Carriers have expressed concern about the amount of capacity represented in the newbuild orderbook and the potential for overcapacity. It could be one factor to tip the current balance, while the emerging return to the routes via the Suez Canal and Red Sea is also expected to free up capacity that was required for the longer routes around Africa.
Linerlytica points to Asia as continuing to be the “hot spot” for the most port congestion. Shanghai is high at the moment, in part as it recovers from a recent typhoon, while Singapore and Hong Kong also have high numbers of TEU at anchor. Similarly, the major ports of Northern Europe, Rotterdam, Antwerp, and Hamburg, also have persistent congestion issues, while there continues to be a factor of capacity caught in the Middle East due to the challenges in the Persian Gulf, Strait of Hormuz, and nearby ports.