
Global Energy Demand Slowing Down, Renewables Up
The 2017 edition of the BP Statistical Review of World Energy, published on Tuesday, shows the long-term changes underway in the energy market.
The report highlights that there is slower growth in global energy demand, demand is moving strongly towards the fast-growing developing economies of Asia and there is a marked shift towards lower carbon fuels as renewable energy continues to grow strongly and coal use falls.
In 2016 global energy demand was weak for the third consecutive year, growing by just one percent, around half the average growth rate of the past decade. Almost all this growth came from fast-growing developing economies, with China and India together accounting for half of all growth.
.jpg) Renewables were again the fastest growing of all energy sources, rising by 12 percent. Although providing still only four percent of total primary energy, the growth in renewables represented almost a third of the total growth in energy demand in 2016. In contrast, use of coal – the most carbon-intensive of the fossil fuels – fell steeply for a second year, down by 1.7 percent, primarily due to falling demand from both the U.S. and China.
Renewables were again the fastest growing of all energy sources, rising by 12 percent. Although providing still only four percent of total primary energy, the growth in renewables represented almost a third of the total growth in energy demand in 2016. In contrast, use of coal – the most carbon-intensive of the fossil fuels – fell steeply for a second year, down by 1.7 percent, primarily due to falling demand from both the U.S. and China.
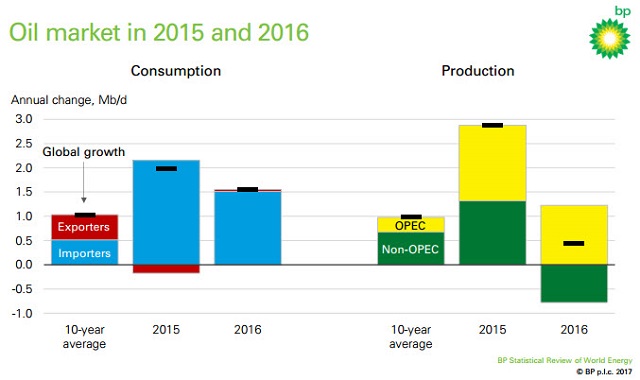
The year’s low prices drove demand for oil higher by 1.6 percent while growth in production was limited to only 0.5 percent. As a result, the oil market returned broadly back into balance by mid-year, but prices continued to be depressed by the large overhang of built-up inventories.
Natural gas production was also adversely affected by low prices, growing by only 0.3 percent. U.S. gas output fell in 2016, the first reduction since the advent of the shale revolution in the mid-2000s.
The combination of weak energy demand growth and the shifting fuel mix meant that global carbon emissions are estimated to have grown by only 0.1 percent – making 2016 the third consecutive year of flat or falling emissions. This marks the lowest three-year average for emissions growth since 1981-83.
.jpg) Primary energy
Primary energy
Global energy demand grew by one percent in 2016 – similar to rises of 0.9 percent and one percent seen in 2015 and 2014 respectively and significantly lower than the 10-year average rate of growth of 1.8 percent.
Almost all growth came from fast-growing developing economies; China and India together accounted for around half of all growth.
Indian energy demand grew by 5.4 percent, a similar rate to that seen in recent years.
Chinese energy demand, however, grew by 1.3 percent. This is close to the 1.2 percent rise in energy demand in 2015 and around a quarter of its 10-year average growth.
Average growth during 2015 and 2016 was the lowest over a two-year period since 1997-98. Despite this slowing, the incremental increase in demand in China made it the world’s largest energy growth market for the 16th consecutive year.
Demand from the developed OECD countries remained essentially flat (rising just 0.2 percent).
Renewables
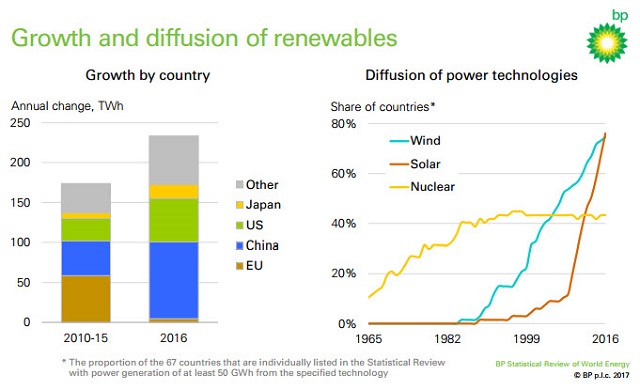 Once again, renewables were the fastest growing energy source in 2016. Not including hydroelectric power, renewable energy grew by 12 percent. While below the 10-year average rate of growth for renewables of 15.7 percent, this still represented the largest annual incremental increase in output on record (an increase of 55Mtoe – more than the decline in coal consumption).
Renewables now provide a share of just under four percent of primary energy.
More than half of growth in renewable power came from wind, which rose by 16 percent in the year. Solar energy grew by 30 percent. Despite solar energy making up only 18 percent of renewables output, growth in solar represented around a third of the overall growth in renewable power.
In 2016, China became the world’s largest single producer of renewable power, overtaking the U.S., and Asia Pacific overtook Europe and Eurasia to become the largest producing region for renewable power.
Oil
 Dated Brent averaged $44 a barrel in 2016, down from $52 in 2015 and the lowest annual average price since 2004.
Global oil consumption grew strongly, rising by 1.6 percent, or 1.6 million barrels a day (mmb/d), above the 10-year average rate for a second consecutive year. Strong increases in demand were seen from India (up 0.3mmb/d) and Europe (up 0.3mmb/d) and while demand from China continued to grow (up 0.4mmb/d) it was lower than in recent years.
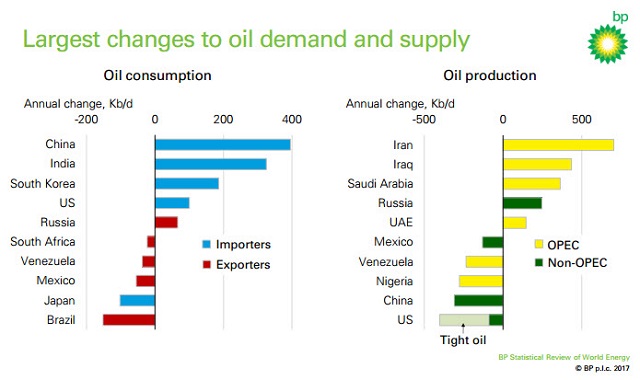 Weak prices impacted the growth of global oil production which rose by just 0.5 percent - the lowest increase since 2009 – or 0.4mmb/d. Within this total, production from OPEC increased by 1.2mmb/d, with significant increases seen from Iran (up 0.7mmb/d), Iraq (up 0.4mmb/d) and Saudi Arabia (up 0.4mmb/d).
In contrast, non-OPEC oil production fell by 0.8mmb/d, the biggest annual decline for around 25 years. The largest output falls were from the US (down 0.4mmb/d), China and Nigeria (each down 0.3mmbd).
Natural gas
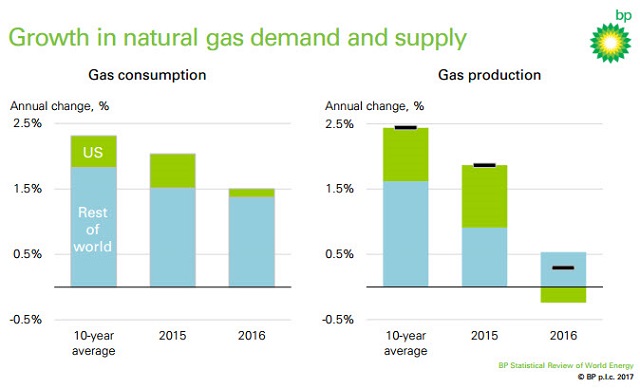 Global natural gas consumption rose by 1.5 percent in 2016, slower than the 10-year average rate of 2.3 percent. However, there were strong increases in gas consumption in Europe (up six percent), the Middle East (up 3.5 percent) and China (up 7.7 percent).
Global natural gas production rose by only 0.3 percent - the weakest growth in gas output for 34 years, outside the financial crisis. With lower gas prices, US gas production fell for the first time since the shale gas revolution began. Australian gas production rose significantly as new LNG facilities came on stream.
Global LNG imports/exports grew by 6.2 percent, driven by the new Australian output. LNG production is expected to grow by around 30 percent in next three years as further new projects come on line.
The rise of LNG trade reflects an ongoing continuing fundamental shift in global gas markets towards greater integration, but also towards more competitive and flexible markets – with increasing volumes of LNG under shorter or smaller contracts or uncontracted.
Coal
Global coal consumption fell for the second successive year, down by 1.7 percent or 53 million tonnes of oil equivalent (Mtoe). This decline brought coal’s share of primary energy production to 28.1 percent, its lowest share since 2004.
Declining consumption was driven primarily by the U.S. (down 8.8 percent, 33Mtoe), and China (down 1.6 percent, 26Mtoe)
World coal production fell by 6.2 percent or 231Mtoe, the largest annual decline on record. The falls in production were again driven by China (down 7.9% or 140Mtoe) and the U.S. (down 19 percent, or 85Mtoe).
In the U.K., coal consumption more than halved (-52.5 percent). UK coal consumption has now fallen to levels last seen at the start of the Industrial Revolution around 200 years ago. The U.K. power sector recorded its first ‘coal-free’ day in April 2017.
Other fuels
Nuclear power generation grew by 1.3 percent, or 9.3Mtoe, in 2016. A 24.5 percent annual increase in Chinese nuclear output accounted for all the net growth in nuclear power. China’s incremental increase of 9.6Mtoe was the largest from any country since 2004.

that matters most
Get the latest maritime news delivered to your inbox daily.
Hydroelectric power generation increased by 2.8 percent in 2016 – rising by 27.1Mtoe. The largest incremental growth again came from China and then the U.S.
The review is available here.