
Measuring the Deepwater Horizon Oil Spill
The Deepwater Horizon oil spill began on April 20, 2010, and the Deepwater Horizon sank in about 5,000 feet (1,500 meters) of water on April 22. The sinking of the platform caused crude oil to gush out of the riser — the 5,000-foot pipe that connects the well at the ocean floor to the drilling platform on the surface. After a series of failed efforts to plug the leak, BP said on July 15 that it had capped the well, stopping the flow of oil into the Gulf of Mexico after 86 days.
The rate of oil release became the subject of intense debate. Throughout the first month of the spill, government responders officially adhered to what were later known to be low and inaccurate estimates. Non-governmental scientists used the small amount of publicly available flow data to generate estimates that proved to be much more accurate. Live video feeds of the leak from the ocean floor fueled the controversy over the magnitude of the leak.
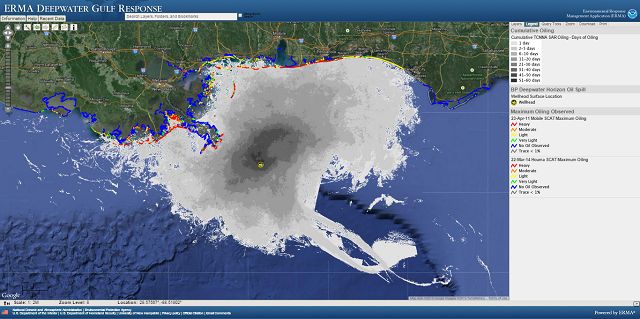
The oil slick produced by the Deepwater Horizon oil spill covered as much 28,958 square miles (75,000 square kilometers), an area about the size of South Carolina, with the extent and location of the slick changing from day to day depending on weather conditions. By the first week in June, oil had come ashore in Louisiana, Mississippi, Alabama and Florida, with significant wildlife fatalities in Louisiana.
 Credit: NOAA
In the weeks following the accident, scientists discovered enormous oil plumes in the deep waters of the Gulf of Mexico, raising concerns about ecological harm far below the surface that would be difficult to assess.
Although responders stated that accurate flow-rate estimates were not important to their operations, the Unified Command eventually felt a need to assert leadership on the issue, possibly as a result of media attention and public criticism of the low early numbers. On May 19, 2010, the National Incident Command spearheaded the creation of an inter-agency Flow Rate Technical Group and charged it with generating a preliminary flow rate as soon as possible and a final flow-rate estimate based on peer reviewed methodologies within two months.
On May 23, Dr Marcia McNutt, Director of the U.S. Geological Survey and Science Advisor to the Secretary of the Interior, was appointed the Group’s leader.
The National Commission on the BP Deepwater Horizon Oil Spill and Offshore Drilling tracked the changing estimates of the volume of oil spilt. The emerging consensus was that roughly five million barrels of oil were released, with roughly 4.2 million barrels pouring into the waters of the Gulf of Mexico.
May 27 Estimate (12,000-25,000 bbls/day)
The Flow Rate Group published its first estimate on May 27, 2010, noting that the only range of flow rates that is consistent with all three of the methods considered by the Group was 12,000 to 19,000 barrels per day.
June 10 Estimate (20,000-40,000 bbls/day)
On June 10, the Flow Rate Group announced a revised flow-rate estimate of 25,000 to 30,000 bbls/day with a lower bound of 20,000 and a higher bound of 40,000 bbls/day. The Group also noted an estimate by researchers with Woods Hole, led by Dr Richard Camilli, who were conducting their work outside of the auspices of the Flow Rate Group but in coordination with Unified Command. Camilli’s researchers had used an ROV mounted with sonar and acoustic sensors to determine the volume and velocity of the outflow from the end of the riser and kink leak. Their initial rough estimate was a flow rate for total flux (oil plus gas) of between 65,213 and 124,991 bbls/day (0.12 to 0.23 cubic meters/second).
June 15 Estimate (35,000-60,000 bbls/day)
On June 15, the Flow Rate Group announced that it had generated a new official flow estimate of 35,000 to 60,000 bbls/day. The new estimate was based on a combination of analyses of high resolution videos taken by ROVs, acoustic technologies and measurements of oil and pressure at the site.
DeepWater Horizon - Capping Stack Installation (time lapse)
The Last Estimate (52,700-62,200 bbls/day)
The June 15 estimate was finally updated on August 2. A press release announced that, at the outset of the spill, the flow rate was 62,000 bbls/day (±10 percent), but that it had declined to 53,000 bbls/day (±10 percent) by the time the well had been capped on July 14.
Given the new figures, it was estimated that the total amount of oil discharged during the spill was 4,928,100 barrels (± 10 percent, which gives a range of 4,435,290 to 5,420,910 total barrels).
So, the emerging consensus was that roughly five million barrels of oil were released. Using different methods, the government teams and independent scientists eventually arrived at the same approximate figure.
BP Deepwater Horizon Accident Investigation Report
Survey of Deepwater Horizon Site (No Audio) | Nautilus Live
More information is available from The Encyclopedia of Earth here.
The opinions expressed herein are the author's and not necessarily those of The Maritime Executive.
