New Gravity-Field Map Made for Ocean Floor
An international scientific team recently published a new map of the ocean floor based on Earth’s gravity field, and it is a particularly useful tool, says NASA. Such seafloor maps can aid submariners and ship captains with navigation, particularly in previously uncharted areas. They are helpful to prospectors scouting for oil, gas and mineral resources, and the maps comprise nearly 80 percent of the seafloor that you see when you scroll through Google Earth.
But where the seafloor gravity maps may be most useful, according to Dietmar Müller, is in deciphering the evolution of Earth’s continents and tectonic plates. “Detailed maps of the seafloor are a powerful tool for scientists to investigate how and why the underwater features are formed,” said Müller, a geophysicist at the University of Sydney. “Ocean basins are created by motions of the tectonic plates over tens of millions of years. When continents break apart, the story of their separation is recorded in the ocean floor that forms between them.”
The map above shows seafloor gravity anomalies in the western Indian Ocean, as assembled by David Sandwell of the Scripps Institution of Oceanography, Walter Smith of the National Oceanic and Atmospheric Administration, and colleagues. Shades of orange and red represent areas where seafloor gravity is stronger (in milligals) than the global average, a phenomenon that mostly coincides with the location of underwater ridges, seamounts and the edges of Earth’s tectonic plates. The darkest shades of blue represent areas with the lowest gravity, corresponding to the deepest troughs and trenches in the ocean.
The maps were created through computer analysis and modeling of new satellite data from the European Space Agency’s CryoSat-2 and from the NASA-CNES Jason-1, as well as older data from missions flown in the 1980s and 90s. Sandwell and his team derived the shape of the seafloor and its gravity field from altimetry measurements of the height of the sea surface. Mountains and other seafloor features have a lot of mass, so they exert a gravitational pull on the water above pulling more water toward their center of mass. The new map portrays seafloor features as narrow as five kilometers (three miles).
The maps have been a boon to Müller’s research. His team announced in November 2015 that it had used the gravity maps to discover a new oceanic microplate—a small piece of ocean crust that had broken off from larger tectonic plates. The Mammerickx Microplate, named for a pioneer in seafloor mapping (Jacqueline Mammerickx) is the first to be discovered in the Indian Ocean. Its existence helped Kara Matthews (University of Sydney), Müller, and Sandwell establish that the collision between the Indian plate and Eurasia—which has led to the creation of the Himalayas—began about 47 million years ago.
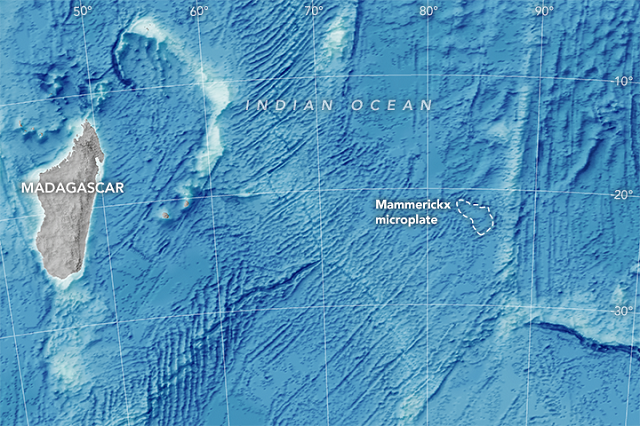
The map below, created by combining sparse ship soundings (which cover just 17 percent of the ocean) with predicted depths from the Sandwell-Smith marine gravity data, shows the complex seafloor topography and tectonic patterns of the southwest Indian Ocean. About 50 million years ago, the Indian plate was moving 15 centimeters per year, about as fast as a plate can move. When it rammed into Eurasia, it caused the entire plate to slow down and change direction; this affected active seafloor spreading along a ridge thousands of kilometers to the south, where the Indian plate meets the Antarctic plate.

Matthews and Müller analyzed the seafloor ripples and ridges in this region and recreated the stresses and motions that eventually ripped a small piece off of the Antarctic plate and spun it like a ball-bearing between two larger plates. The Mammerickx Microplate is roughly the size of West Virginia or Tasmania.

that matters most
Get the latest maritime news delivered to your inbox daily.
“Normal seafloor spreading does not produce microplates, but if you have a collision of one continent with another continent, it causes the whole plate to change direction,” said Sandwell, a co-author of the paper. “As it changes direction, it creates things like microplates.”
The discovery is an example of new research possible because of the new global seafloor maps. Müller and his research group have been actively combing through the data to map fracture zones and better understand the motions of Earth’s plates over tens of millions of years. They have built a new model of the breakup of Pangaea, and reconstructed the formation of the Pacific Ocean Basin. He noted: “The maps from Sandwell and Smith will enable more accurate mapping of the past movements of tectonic plates and may allow better predictions of giant earthquakes, which occur at subduction zones, where plates are converging.”
