Loss of Ocean Oxygen Noticeable by 2030
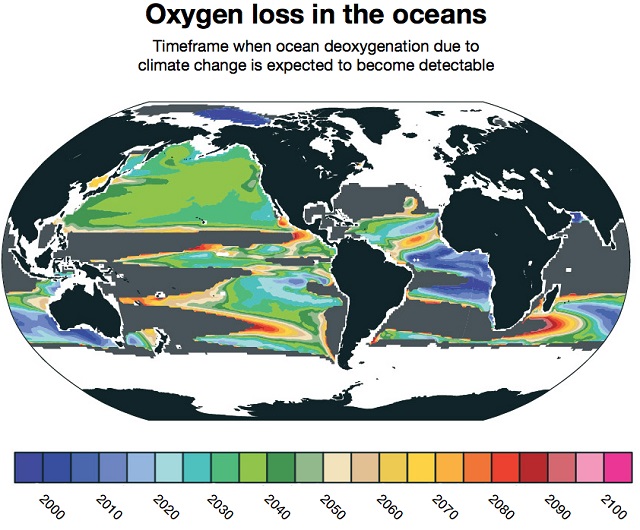
A drop in the amount of oxygen dissolved in the oceans due to climate change is already discernible in some parts of the world and should be evident across large parts of the ocean between 2030 and 2040, according to a new study.
Scientists know that a warming climate can be expected to gradually sap oceans of oxygen, leaving fish, crabs, squid and other marine life struggling to breathe. But it’s been difficult to determine whether this anticipated oxygen drain is already having a noticeable impact.
 Deoxygenation due to climate change is already detectable in some parts of the ocean. Other parts of the ocean, shown in gray, will not have detectable loss of oxygen due to climate change even by 2100. Credit: Matthew Long, NCAR.
“Loss of oxygen in the ocean is one of the serious side effects of a warming atmosphere, and a major threat to marine life,” said Matthew Long, a climate scientist at the U.S. National Center for Atmospheric Research (NCAR) and lead author of the study. “Since oxygen concentrations in the ocean naturally vary depending on variations in winds and temperature at the surface, it’s been challenging to attribute any deoxygenation to climate change. This new study tells us when we can expect the impact from climate change to overwhelm the natural variability.”
Cutting through the natural variability
The entire ocean—from the depths to the shallows—gets its oxygen supply from the surface, either directly from the atmosphere or from phytoplankton, which release oxygen into the water through photosynthesis.
Warming surface waters, however, absorb less oxygen. Additionally, the oxygen that is absorbed has a more difficult time traveling deeper into the ocean, because as water heats up, it expands, becoming lighter than the water below it and less likely to sink.
As part of natural warming and cooling, oxygen concentrations at the sea surface are constantly changing, and those changes can linger for years or even decades deeper in the ocean.
For example, an exceptionally cold winter in the North Pacific would allow the ocean surface to soak up a large amount of oxygen. As a result of the natural circulation pattern, that oxygen would then be carried deeper into the ocean interior, where it might still be detectable years later as it travels along its flow path. Conversely, unusually hot weather could lead to natural “dead zones” in the ocean, where fish and other marine life cannot survive.
To cut through this natural variability and investigate the impact of climate change, the research team relied on the NCAR-based Community Earth System Model.
The scientists used output from a project that ran the model more than two dozen times for the years 1920 to 2100. Each individual run was started with miniscule variations in air temperature. As the model runs progressed, those tiny differences grew and expanded, producing a set of climate simulations useful for studying questions about variability and change.
Using the simulations to study dissolved oxygen gave the researchers guidance on how much concentrations may have varied naturally in the past. With this information, they could determine when ocean deoxygenation due to climate change is likely to become more severe than at any point in the modeled historic range.
The research team found that deoxygenation caused by climate change could already be detected in the southern Indian Ocean and parts of the eastern tropical Pacific and Atlantic basins. They also determined that more widespread detection of deoxygenation caused by climate change would be possible between 2030 and 2040. However, in some parts of the ocean, including areas off the east coasts of Africa, Australia and Southeast Asia, deoxygenation caused by climate change was not evident even by 2100.
Picking out a global pattern
The researchers also created a visual way to distinguish between deoxygenation caused by natural processes and deoxygenation caused by climate change.
Using the same model dataset, the scientists created maps of oxygen levels in the ocean, showing which waters were oxygen-rich at the same time that others were oxygen-poor. They found they could distinguish between oxygenation patterns caused by natural weather phenomena and the pattern caused by climate change.
The pattern caused by climate change also became evident in the model runs around 2030, adding confidence to the conclusion that widespread deoxygenation due to climate change will become detectable around that time.

that matters most
Get the latest maritime news delivered to your inbox daily.
The maps could also be useful resources for deciding where to place instruments to monitor ocean oxygen levels in the future to get the best picture of climate change impacts. Currently ocean oxygen measurements are relatively sparse.
“We need comprehensive and sustained observations of what’s going on in the ocean to compare with what we’re learning from our models and to understand the full impact of a changing climate,” Long said.
