
[Op-Ed] Tanker Arrivals Create Volatility in Oil Market
U.S. crude stocks unexpectedly rose by almost 2.4 million barrels last week, breaking a run of eight consecutive weekly declines and sending oil prices sharply lower.
But did the market overreact when the stock numbers were released on Wednesday - misinterpreting normal week-to-week variability in the data as a fundamental shift in the balance between supply and demand?
Tanker arrivals create quite a bit of "noise" in the weekly inventory data which can easily be confused with shifts in the supply-demand balance over short periods.
Reported crude stockpiles are driven by three factors: domestic crude production, crude imports, and refinery runs. Domestic output is fairly constant week to week, but imports and runs are highly variable.
In 2014, U.S. refineries processed an average of 15.8 million barrels per day (bpd).
Domestic crude production was around 8.7 million bpd in 2014 and the country imported around 7.3 million bpd of crude, according to the Energy Information Administration.
Almost 3 million bpd of imported oil arrived by pipeline or train from Canada, while most of the remaining 4.5 million bpd from other destinations came by tanker.
The typical very large crude carrier (VLCC) or supertanker employed in long-distance voyages carries around 2 million barrels of oil. So, the United States receives the equivalent of two to three VLCC cargoes per day or around 15-16 per week. Imported crude is reported only once it has been cleared through U.S. Customs.
But there is significant variability around these daily and weekly averages. The timing of individual tanker arrivals and completion of customs formalities therefore has a major impact on reported imports for a given week.
Charts one to three, which show weekly imports of crude between 1983 and 2015, make the week-to-week variability apparent.
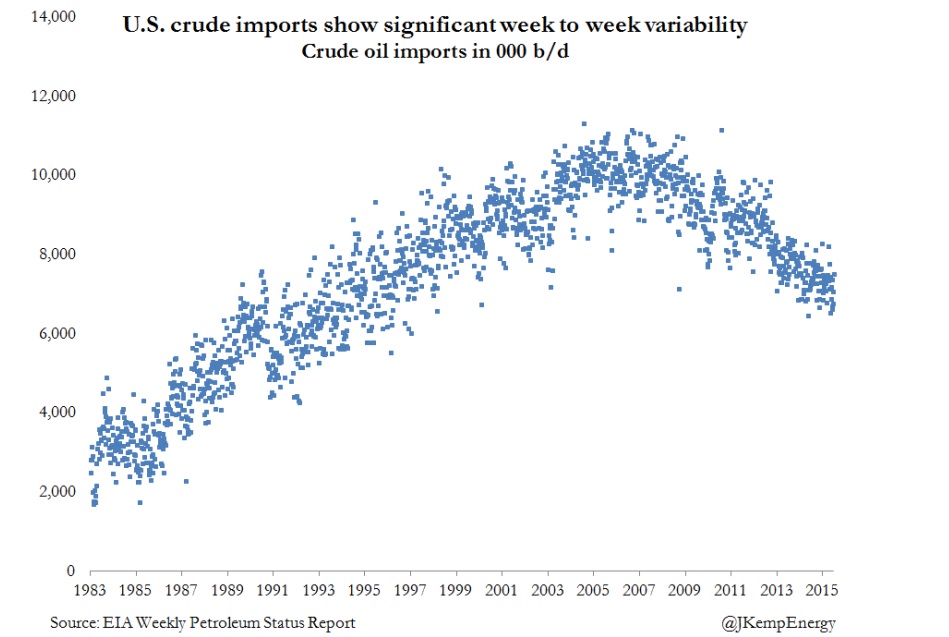
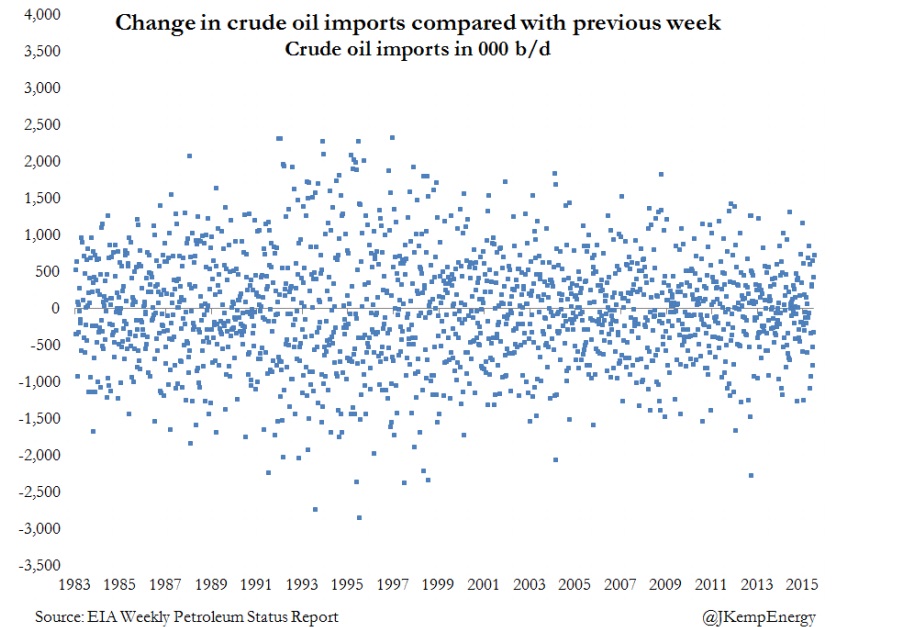
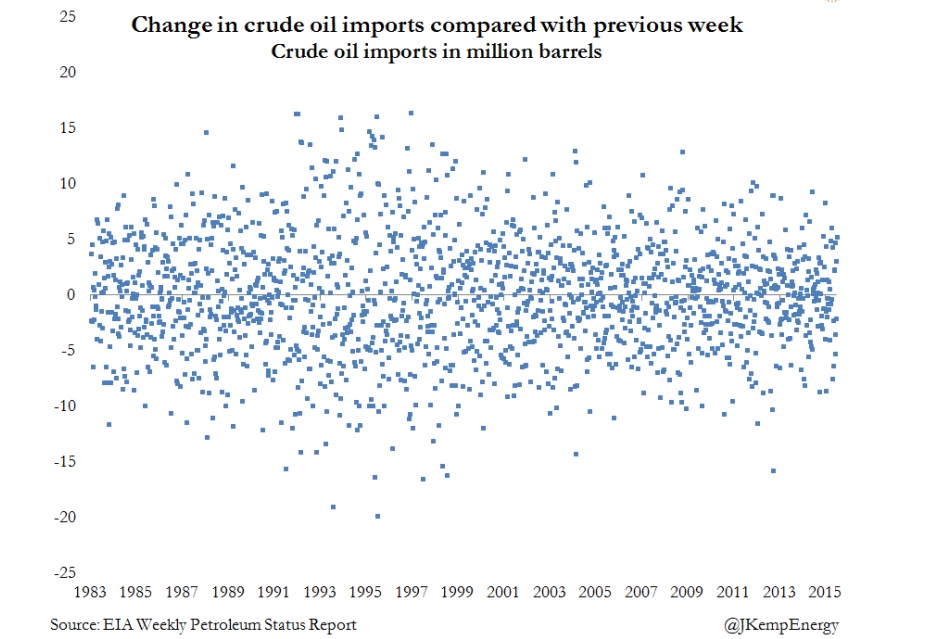
From one week to the next, imports can vary by up to 2.5 million bpd or as much as 15-20 million barrels per week.
The one-week change in imports has a standard deviation of almost 750,000 bpd or about 5.2 million barrels per week.
Fluctuations in imports, as much as refinery runs, have a major impact on the one-week reported change in stock levels.
This is what seems to explain the sudden rise in inventories in the week to June 26.
Crude stocks rose by 2.4 million barrels, compared with a decline of 5.0 million barrels the previous week, and an average decline of 3.5 million barrels over the prior eight weeks.
Refinery throughput was almost exactly unchanged from the previous week at a near-record 16.5 million bpd.
The entire stock change seems to have come from a big boost in imports, which rose by almost 750,000 bpd or 5.2 million barrels per week.
The increase in imports, and reported turnaround in stocks from a 5-million-barrel drawdown to a build of 2.4 million, was well within the normal variability for both the import series and reported inventories.
While it could signal an increasing surplus of supply over demand, it may simply be due to the timing of tanker arrivals, and there is no way to distinguish between the two at a one-week level.
The market's swift response - sending U.S. oil prices down more than $1.50 a barrel to close at the lowest level for more than two months - therefore looks like an overreaction.
By John Kemp

that matters most
Get the latest maritime news delivered to your inbox daily.
The opinions expressed herein are the author's and not necessarily those of The Maritime Executive.