
Australian Stevedoring Revenue Increases
Higher infrastructure charges imposed on trucks and rail operators at Australian ports helped the container stevedoring industry increase average revenue per container lift for the first time in seven years.
According to the Australian Competition & Consumer Commission (ACCC)’s container stevedoring monitoring report, revenues generated by the infrastructure charges rose by 63 percent in 2018-19 on the previous year. The revenue helped to offset an 8.1 percent decline in average quayside revenue because of competition between stevedores and increasing bargaining power of the shipping lines.
Average revenue per lift across both the quayside and landside increased by 1.8 percent to A$268 ($185) per lift.
“It is understandable that stevedores seek to recover some costs of upgrading port facilities from transport operators because they, like the shipping lines, benefit from the investment,” said ACCC Chair Rod Sims. “But because port users have limited ability to move their business in response to a stevedore raising its infrastructure charge, the stevedores face less competitive pressure to keep the charges down. While the infrastructure charges only represent 12 percent of the stevedores’ revenues today, the outcome of this may be that importers and exporters end up paying more to ship goods.”
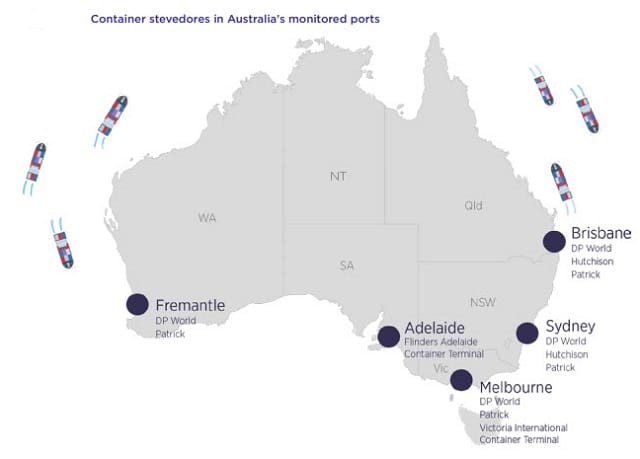
Patrick and DP World operate at the four largest ports—Brisbane, Fremantle, Melbourne and Sydney. Hutchison operates in Brisbane and Sydney, while Victorian International Container Terminal (VICT) commenced operations in Melbourne in early 2017. Flinders Adelaide is the sole terminal operator at Port Adelaide.
Port users will continue to be subject to increasing infrastructure charges, with Hutchison increasing its charges in Sydney in November 2019 and DP World increasing charges at all its terminals from January 2020.
Profitability across the industry remains low with return on tangible assets falling from a high of 27.8 percent in 2011-12 to 3.8 percent in 2018-19, though it varied widely between stevedores. The drop in returns is partly due to the growth in the industry’s asset base after investment in new container terminals in the east coast ports.
The stevedores significantly improved their productivity on the quayside last financial year, with two key productivity measures, labor rate and ship rate, now at record levels. “We found that the productivity of Australian container ports was generally on par with ports of a similar size overseas, with Melbourne the best performer,” Sims said. “It is possible that our ports are not more productive because the distance between ports means competition between them is not very strong.”
Competition within ports led to further shifts in the market share of stevedores with DP World’s share of national lifts falling from 44.4 percent to 39.1 per cent. Patrick picked up new business, and its share of national lifts increased to 43.5 percent. New entrant VICT has established itself as an effective competitor in Melbourne by more than doubling its share of lifts to around 15 percent.
Weaker Container Volumes
A weakening economy dampened demand for stevedoring services in 2018–19, with growth rates far below those reported in the previous year.
The number of lifts made by the international container stevedores fell for only the second time in the last decade. The stevedores reported 5.11 million lifts in 2018–19, down 0.5 percent from the previous year and far weaker than the 8.1 percent growth in lifts experienced last year. The falling demand was most apparent in relation to lifts of full containers, which fell 4.9 percent to 3.77 million. Lifts of full containers declined in both Melbourne and Brisbane, but grew solidly at Fremantle. In contrast, the industry reported a 14.6 percent increase in the number of lifts of empty containers. Empty containers typically generate less revenue than full containers.
Industry volumes were slightly better when measured on a TEU basis, as 40 foot containers continued to be increasingly adopted by industry relative to 20 foot containers. The container terminals reported handling a combined 7.88 million TEU in 2018–19. This represented growth of 0.2 percent, the second lowest rate over the past 10 years.
The report suggests that the slowdown in container volume growth could be due to a slowing in national economic activity, weak conditions in goods distribution industries such as retail and manufacturing during the year and the fact that housing construction and business investment levels have fallen. The drought affecting eastern Australia and floods in Queensland have also had a detrimental impact on volumes of various export commodities such as grain, hay and cotton. New prohibitions put in place by numerous foreign governments on the importation of waste in containers also had a negative effect on full export volumes.

that matters most
Get the latest maritime news delivered to your inbox daily.
The ACCC has monitored the container stevedoring industry since 1998-99 under a direction from the Australian Government.
The report is available here.
