What Do VLCCs Do With Their Time?
The short answer is: supply Asia’s hunger for oil, according to analysts from VesselsValue.com. Analyzing an annual snapshot of the global VLCC traffic, various patterns emerge from AIS data which highlight the importance of the energy hungry Eastern economies. The growing prominence of Angola's exports to China, along with the reduction in the crude imports by the US, is also notable. The reliance of South Korea and Japan on the Middle East for energy security is highlighted, whereas China has a more diversified approach towards sourcing their crude oil requirements.
Waiting Time
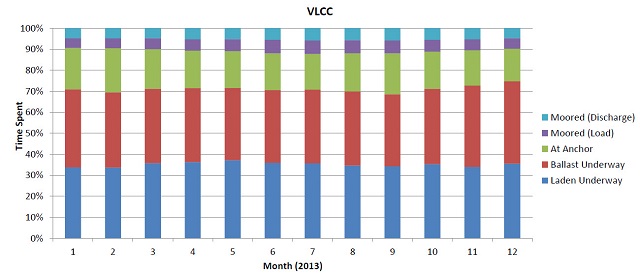 A breakup of how the average fleet spends its time is calculated on a monthly basis. Congestion time plays an important role in determining the fleet productivity as is the ratio between the laden to ballast days. Seasonality and geopolitical issues also play a major role in the changes underlying the utilization metrics e.g. sanctions on the Iranian VLCC fleet.
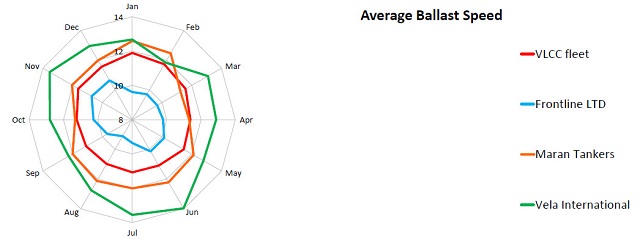
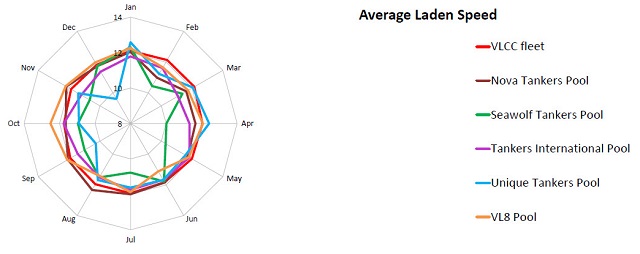
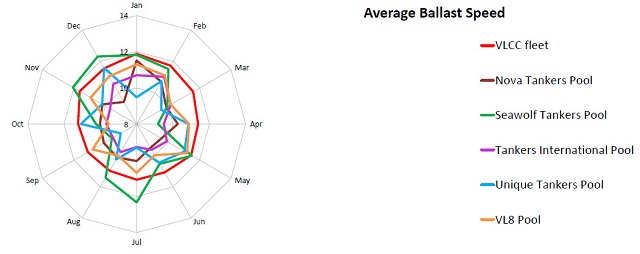
Speed
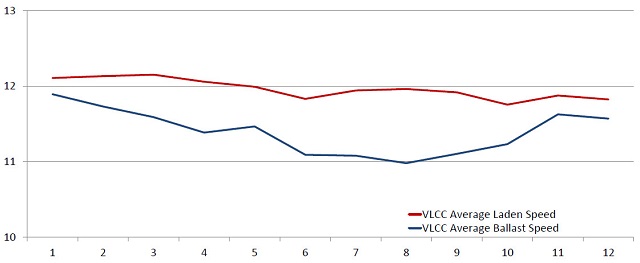
The productivity of the VLCC fleet would be conditioned by the (average) speed, time spent carrying out cargo operations, port congestion, optimal stowage or deadweight utilization. Fluctuations in the average speed (both laden and ballast) are attributable to a combination of weather, bunker prices and possibly oversupply.
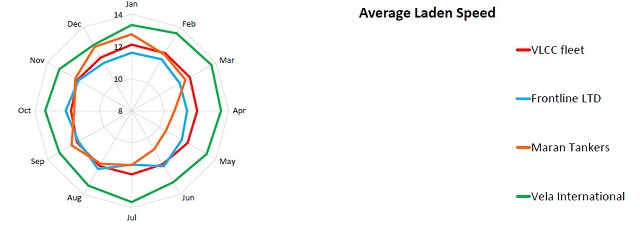
Operational Performance
Operational performance metrics are often hard to quantify due to data availability and fleet heterogeneity. VesselsValue.com takes a unique approach by utilizing its existing vessel database along with its AIS based analytics to build a comprehensive picture to analyze key performance indicators (KPI's) for VLCC operators and pool operators.
VesselsValue.com has selected three prominent owners and benchmark tow KPIs with the global fleet average over 12 months. Frontline and Maran tankers metrics are almost indistinguishable from each other and from the global benchmark however Vela with its comparative advantage are quite prominent in the comparison.
 Pool operators performance is also benchmarked in a similar fashion to vessel owners to assess their ability to outperform the global fleet as a benchmark. VesselsValue.com data reveals that except for the Unique tankers pool, most other pools have superior laden/ballast ratios.
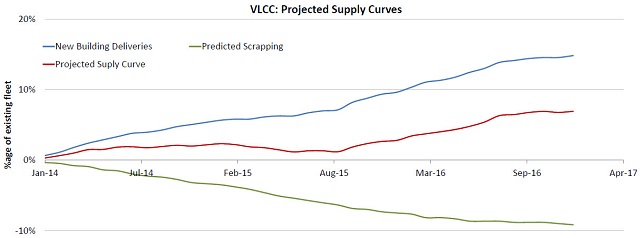
 VLCC Projected Supply Curve
Projected supply curves are computed by taking the difference between the vessel delivery schedule and the projected scrapping activity of the VLCC sector. The scrapping activity is projected based on an algorithm that mimics the decision making ability of a ship owner and takes into account the average scrap age, special survey positions etc. In the case of the delivery schedules, there is an element of slippage or lag with yards in various countries exhibiting delays in their delivery schedules. Multiple scenarios based on yard slippage and scrapping assumptions may be generated, however the graph below is a fair representation of the future supply curve, says VesselsValue.com.