
Crude Prices Expected to Remain Mostly Flat
The U.S. Energy Information Administration (EIA) forecasts mostly flat crude oil prices and increasing production in 2018 and 2019. The price of Brent crude oil averaged $54/barrel (b) in 2017, an increase of $10/b from 2016. EIA’s January Short-Term Energy Outlook forecasts Brent to average $60/b in 2018 and $61/b in 2019. In both 2018 and 2019, EIA expects total global production to be slightly greater than global consumption, with U.S. production increasing faster than production in any other country, contributing to modest inventory builds.
EIA forecasts the West Texas Intermediate (WTI) crude oil spot price will average $55/b in 2018 and $57/b in 2019. Average WTI crude oil prices are forecast to stay between $4/b and $5/b lower than Brent prices in both 2018 and 2019, falling from the $6/b average price difference seen in the fourth quarter of 2017. The narrowing price discount of WTI to Brent in the forecast is based on the assumption that current constraints on the capacity to transport crude oil from the Cushing, Oklahoma, storage hub to the U.S. Gulf Coast will gradually lessen.
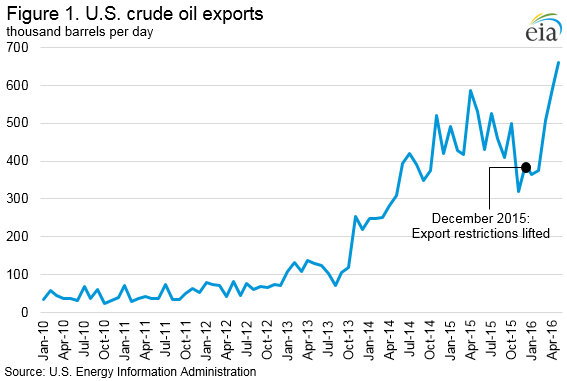
Figure 1. West Texas Intermediate (WTI) crude oil price
Because U.S. production increases will need to compete for market share in Asia, the difference between Brent and WTI prices is supported by cost differences to get there. EIA estimates that, without pipeline constraints, moving crude oil from Cushing to the U.S. Gulf Coast typically costs $3.50/b and that it costs approximately $0.50/b more to transport WTI from the U.S. to Asia than to ship Brent from the North Sea to Asia. Although more infrastructure to export crude oil has been recently built, U.S. exporters must still use smaller, less-economic vessels or complex shipping arrangements, which add to costs.
EIA estimates that the implied global stock change (the difference between total world consumption and total world production) averaged 0.4 million barrels per day (b/d) in 2017, marking the first year of global inventory draws since 2013. EIA expects global inventories to increase by about 0.2 million b/d in 2018 and by about 0.3 million b/d in 2019. EIA forecasts that the expectation of inventory builds in 2018 and 2019 will contribute to Brent crude oil prices declining from current levels ($69.08/b on January 9) to an average of $60/b during the first quarter of 2018.
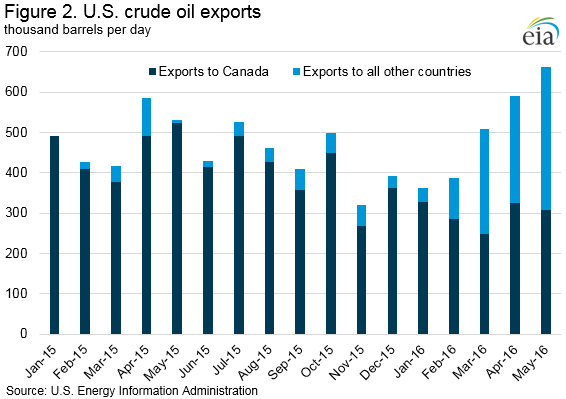
Figure 2. World liquid fuels production and consumption balance
Despite the prospect of flat crude oil prices into the future, EIA forecasts total U.S. crude oil production will increase to an average of 10.3 million b/d in 2018, up 1.0 million b/d from 2017. That level would be the highest annual average on record, surpassing the previous record of 9.6 million b/d set in 1970.
In 2019, crude oil production is forecast to rise to an average of 10.8 million b/d. The Permian region alone is expected to produce 3.6 million b/d of crude oil by the end of 2019, which is about 33 percent of total U.S. crude oil production and about 0.8 million b/d more than estimated December 2017 levels.
Crude oil production from the Organization of the Petroleum Exporting Countries (OPEC) averaged 32.5 million b/d in 2017, a decrease of 0.2 million b/d from 2016. The decline was mainly a result of the November 2016 OPEC production agreement that aimed to limit OPEC crude oil output to 32.5 million b/d. OPEC and non-OPEC participants agreed on November 30, 2017 to extend the production cuts through the end of 2018 in an effort to reduce global oil inventories. EIA expects OPEC crude oil production to increase by 0.2 million b/d in 2018 and by an additional 0.3 million b/d in 2019 as it slowly returns to pre-agreement levels.
Global consumption of petroleum and other liquid fuels grew by 1.4 million b/d in 2017, reaching an average of 98.4 million b/d for the year. EIA expects consumption growth will average 1.7 million b/d in 2018 and 1.6 million b/d in 2019, driven by the countries outside of the Organization for Economic Cooperation and Development (OECD). Non-OECD consumption growth is expected to account for 1.2 million b/d and 1.3 million b/d of the growth in 2018 and 2019, respectively. The forecasted non-OECD petroleum and other liquid fuels consumption growth is driven by expectations of increased Gross Domestic Product (GDP) growth. Growth in non-OECD GDP is expected to be 4.3 percent in 2018 and 4.4 percent in 2019, up from 3.9 percent in 2017.

that matters most
Get the latest maritime news delivered to your inbox daily.
Of the non-OECD countries, EIA expects India and China to be the largest contributors to growth in petroleum and other liquid fuels consumption in both 2018 and 2019. China’s consumption is expected to increase by 0.4 million b/d in 2018, followed by a 0.3 million b/d increase in 2019. India, which saw slower-than-expected liquid fuels consumption growth of less than 0.1 million b/d in 2017 (partly because of monetary and fiscal policy changes) is expected to experience stronger consumption growth in 2018 and 2019 at about 0.3 million b/d in each year.
In OECD countries, petroleum and other liquid fuels consumption increased by 0.4 million b/d in 2017, and EIA then expects it to grow by 0.5 million b/d in 2018 and by 0.3 million b/d 2019. The main driver of OECD consumption growth is the U.S. Total U.S. petroleum and other liquid fuels consumption is forecast to average 20.3 million b/d in 2018, an increase of 470,000 b/d (2.4 percent) from the 2017 level, and is forecast to grow by 340,000 b/d (1.7 percent) in 2019. The growth in both years is led primarily by higher consumption of hydrocarbon gas liquids with more modest increases in distillate, motor gasoline, and jet fuel.