
Radar Overlay to Improve ECDIS Navigation
By Vladimir Fadeev
The step-by-step introduction of ECDIS as mandatory equipment aboard vessels began in 2012 and will be completed by 2018. By that time, navigators should be familiar with the fundamental principles for using ECDIS as a part of an integrated shipboard navigational system and be able to react promptly to system malfunctions and/or failures.
Although attempts have previously been made to combine different types of navigational information, e.g., AIS (Automatic Identification System) with radar images, ECS (Electronic Chart System) became the first full-featured integrator of this kind – a computer system combining information from a pre-defined set of external sensors on one screen with an electronic chart as the backdrop.
Whereas early ECS could only display GPS locations on an electronic chart, today’s ECDIS can integrate course data from gyro, satellite and magnet compasses as well as data from echo sounders, wind sensors, AIS, ARPA and other sources. The added data provide vital support for navigational tasks.
However, the apparent seamlessness of integrated navigational data may lead to the navigator placing excessive trust in navigational technology and failing to recognize system malfunctions. This is why the Manila Amendments to the Seafarers' Training, Certification and Watchkeeping Convention (STCW) place particular emphasis on a navigator’s skills in correctly determining probable system errors and reacting adequately to them. This, in turn, requires not only a clear understanding of the fundamental principles of ECDIS performance but of dedicated technological aids as well.
Radar overlay (a raw radar image overlaid on an electronic chart) is the best means of verifying cartographic data and the output of navigation sensors. The radar overlay feature of an ECDIS not only duplicates the radar itself, as some navigators know, but can also be used to verify the entire navigational system. The purpose of this article is to explain how this works.
Radar-ECDIS Integration
Radar-ECDIS integration technologies include “digital NMEA integration” and radar processors. The former allows for input of tracked target data into ECDIS, provided the radar has ARPA; the latter allows analog-digital transformation of the video signal from the radar and input of this signal into the ECDIS, as can be seen in Figure 1.

Figure 1: Radar image overlay.
With radar data on a chart backdrop, potentially confusing effects that would remain unnoticed on a radar screen become visible. There are three main effects to consider:
1. The first is due to radars having an antenna pattern width: the bigger the antenna’s physical size, the narrower the pattern, with the typical figure being roughly one degree by azimuth. The result is that any object, even a point object such as a buoy, is enlarged by that same value on the screen. For instance, a buoy one mile from a radar with a one-degree antenna pattern seems 30 meters in size on the chart, and the farther from the radar, the bigger it will be.
Moreover, angular enlargement is not the only kind of distortion; distance is also increased due to the finite length of radar pulses. At short pulses of about 50 nano-seconds, the distortion can be up to 10 meters; at middle and long pulses the effect is even stronger (Figure 2).
So, a point object on a chart looks much bigger than its true physical size on the radar image. To avoid being confused by this, a navigator must remember that the true location of an object is in the middle of the mark’s front - see Figure 2.
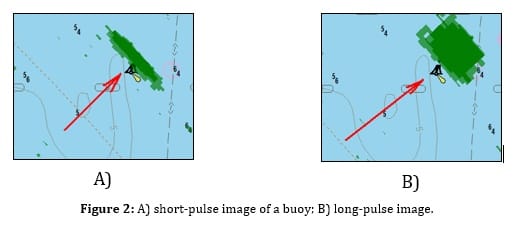
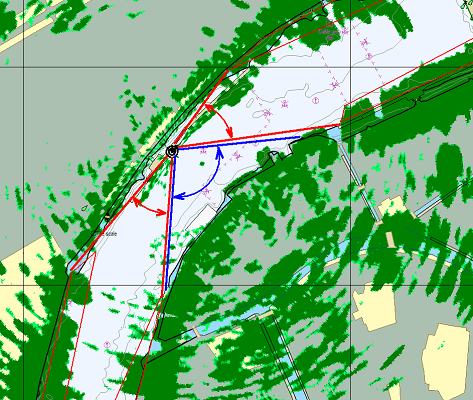
2. The same causes give rise to another confusing visual effect: Reflections from a coastline that are generated at sharp angles appear farther from shore than they actually are (red sectors in Figure 3). Coastline reflections generated at near-right angles (blue sector in Figure 3) show no such distortion.Figure 2: A) short-pulse image of a buoy; B) long-pulse image.
|
|
|
|
|
Figure 3: Shifted reflection from the coastline at sharp observation angles (red lines).
This takes us to a practically significant conclusion: Sailing along a coastline, the navigator can trust only those reflections from the coastline that come from segments currently observed at near-right angles. The same effect, in principle, can also be observed right on the radar screen, but maybe not so clearly. It is the chart background under a radar image that helps to reveal the effect.
3. The third effect that has to be taken into account is that the coastline reflection does not necessarily come from the coastline itself and therefore might not coincide with the coastline on the chart. This happens because most reflections comes from sharp slopes or massive on-shore objects, while gentle slopes produce poor reflections and therefore may be poorly visible. See Figure 4, where the actual (but invisible on a radar image) coastline is shown with a red dotted line.
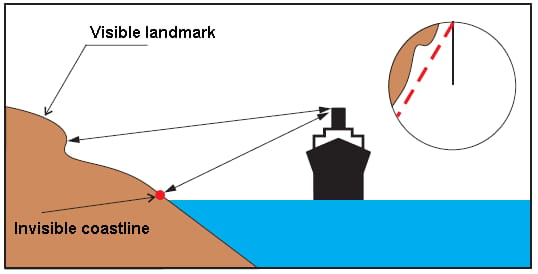
Figure 4: Radar-visible and invisible segments of the coastline.
However, mismatches like that between the coastline shown on the radar image and on the charts are quite common and recognized. See Figure 5.
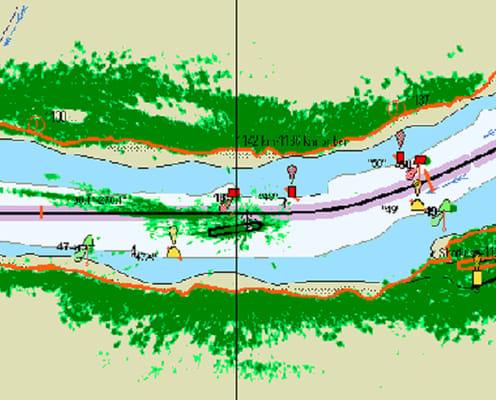
Figure 5: Non-systematic (random) mismatch between the radar image and cartographic coastline.
It is important that a navigator doesn't get confused by the discrepancy between the coastline viewed via the radar and that shown on the chart.
Malfunctions and ECDIS performance
Keeping in mind what we have said about integrating radar and ECDIS, let’s look at how malfunctioning navigational systems may affect ECDIS performance.
The most dangerous malfunctions are due to cartographic errors. Such errors result from causes lying beyond the scope of this article. We only presume that cartographic errors do happen, so charts shall never be considered absolutely trustworthy (in retrospect, cases were documented of islands missing from navigational charts). So the question is whether the navigator is able to determine errors of this kind. It is often said that an experienced navigator in a familiar area can easily do so by using their experience and intuition. But what if they aren’t familiar or visibility is poor?
Of all ECDIS functionality, radar overlay is the most effective in situations like these, as acknowledged in IMO Circular #255. Mismatch between a coastline on the chart and the radar image might be an indicator of a cartographic error, though the other possible causes of visual distortions of a coastline described above should be kept in mind.
Occasionally, cartographic errors may occur on charts because of recalculation errors between local and WGS-84 data (geodetic coordinate systems). Errors of this kind add a systematic shift to the true position of a line or an area - see the red co-directional arrows of roughly equal lengths in Figure 6.
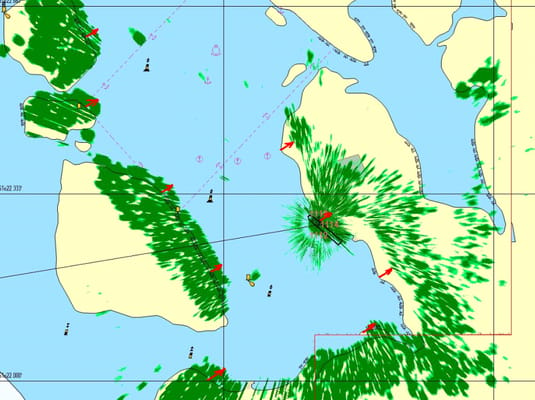
Figure 6: Radar image shift due to recalculation errors.
Positioning system errors can also occur. Although GPS (GLONASS) devices have proven so reliable that we trust them absolutely, they do sometimes malfunction, showing errors of up to one hundred meters. The question is: How can the navigator determine this?
One method is to switch the positioning system into differential mode, though this is often unavailable. Verification of echo sounder data against bathymetry on the chart may help too, along with using traditional positioning techniques. Radar image analysis is, however, the best method. If a coastline shows a constant degree of shift when a radar image is overlaid on a chart (e.g., in Figure 6), this is strong evidence of a systematic GPS error. With GPS running correctly, both coastlines coincide fairly accurately, as in Figure 7.
Figure 7: Correct GPS performance.
Sensor errors may also misinform the navigator about the course of a vessel and also produce false bearings to targets, resulting in misinterpretation of the navigational situation in general. How can radar overlay help in a case like this? It can display a radar image that appears to be rotated, with respect to the chart, around the current ship position by an angle of error as indicated by the red counter-directed arc pairs 1 a/b and 2 a/b in Figure 8.
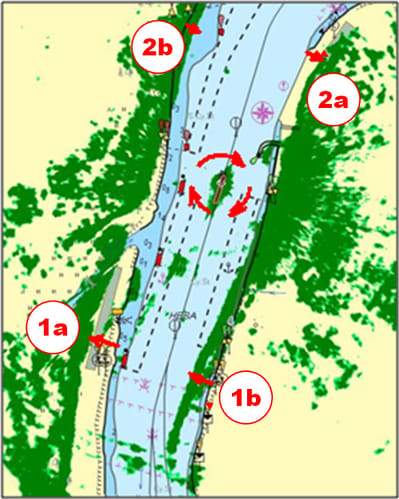
Figure 8: Rotated radar image due to course sensor error.
AIS information, mandatory on board SOLAS vessels since 2008, can also be checked against a radar image. As long as AIS is functioning correctly, AIS targets on an ECDIS coincide with radar reflections by angle and range. The same is true for ARPA.
Investing in Radar Overlay
So how much does radar overlay cost? The price for a modern radar processor typically ranges from $1,500 to $4,000 (typically only five to 20% of the total ECDIS price, depending on other ECDIS options included), which seems like good value.

that matters most
Get the latest maritime news delivered to your inbox daily.
With radar overlay enabled, you can efficiently verify your ECDIS performance in real time. The workflow couldn't be simpler: No prior preparations (calculations, set-up, etc.) are needed. All you do is check the radar image against the chart. – MarEx
Vladimir Fadeev is a Senior Developer at Jeppesen.
