
Container Shipping: Is Strong Demand Sustainable?

DEMAND
Two key trading lanes attract attention these days: one being the major battlefield today – the other being the potential battlefield of tomorrow.
Today’s main battlefield is the Far East to Europe trading lane, which recorded a demand growth of 8.0% in the first seven months of the year as compared to the same period last year according to CTS. August contributed further to a strong year, coming in 8.6% higher than August 2013. Knowing the sad state of the European economies, unfortunately, such a strong increase in demand appears to originate more from inventory restocking than anything else.
Regardless of the reason, the strong demand side has brought down the number of idle ships and eased the integration of newbuilt Ultra Large Containerships (ULCS) into the Far East to Europe trading lane. At the same time, freight rates have been firm until the start of the peak season. At the busiest time of the year in container shipping it appears as though the market has been awash with tonnage. This has brought freight rates down. The recent Golden Week holiday in China has caused supply to contract to meet the new level of demand. It remains to been seen whether the next round of General Rates Increases can turn the tables once more and bring about higher freight rates.
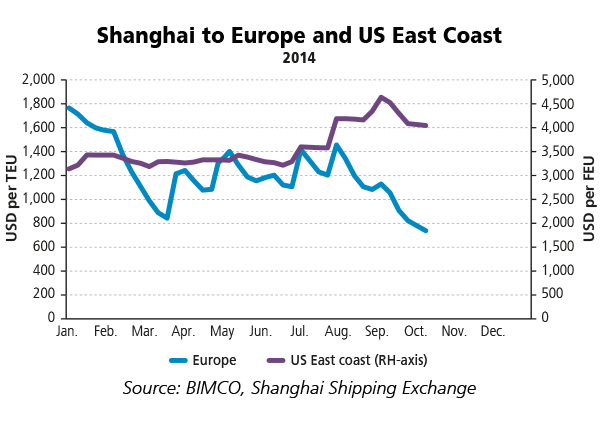
Regarding the battlefield of the future – the Far East to US East Coast trading lane – we have seen a very steady freight rate level improve going into the peak season. Hitting a new record high level on 1 August USD 4,187 per FEU, rates peaked at USD 4,636 per FEU a month later. BIMCO data shows a demand growth of 8.7% for the first eight months leading the rally.
Why might the Far East to US East Coast lane become the battlefield of the future? For several reasons. A) The expansion of the Panama Canal to service container ships up to 13,000 TEU from 2016. B) The enlargement of Suez Canal started only a couple of months ago. C) The heightening of the Bayonne Bridge to allow ULCS to call New York/New Jersey. D) The ongoing delivery of ULCS is likely to introduce some of the cost-effective ULCSs on this long-haul trade to reap the economics of scale, beyond the preferred trade for them which is Far East to Europe. E) The expansion of other US East Coast ports that allow them to receive the giant vessels in future, by dredging and introducing larger “Super-Post-Panamax” cranes. The volume growth is already there with much room for expansion. Time will tell how that trade will develop.
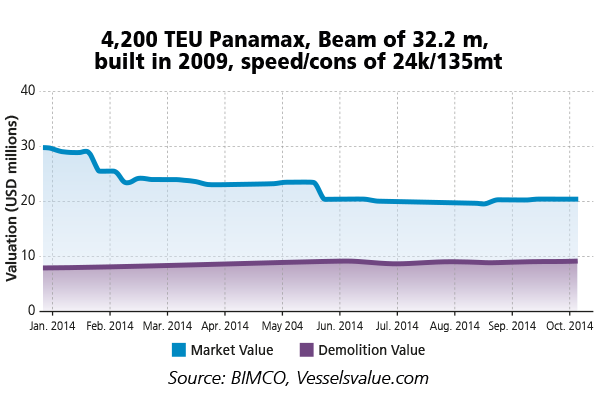
Extremely poor demand for second-hand Panamax ships of 4,000 TEU has brought asset prices to the floor for that ship type and size. According to vesselsvalue.com, second-hand prices are down by 26% to 38% since the beginning of the year. This can be compared to positive developments in prices for all ships of a larger size.
The graph show the development in valuation of a 4,200 TEU Panamax ship built in 2009 with a beam of 32.2 meters and a speed consumption specification of 24 knots at 135 tonnes.
SUPPLY
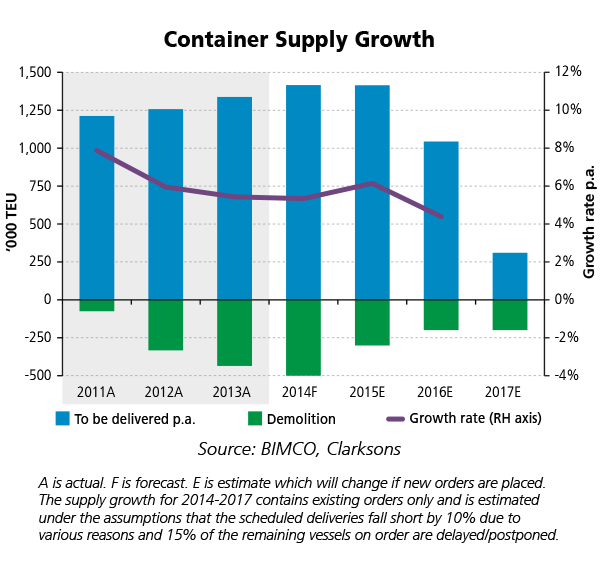
We have seen a strong individual “commitment” to mitigate the supply side impact from the liner companies during the last 2-3 years. Nevertheless, developments during the past two months have derailed this somewhat. The fleet has grown by 4.9% in the year so far, and is on track to grow faster this year than in 2013 on an annualized basis. The demolition of non-competitive ships, which has been brisk in the first seven months, has cooled down promptly in August/September from a monthly average of 43,618 TEU in the months of January to July to a monthly average of just 14,569 TEU in the most recent two months. This indicates that demolition going forward may not be as strong as it has been this year and the year before. Year-to-date scrapping now amounts to 335,000 TEU.
Moreover, investors have lost their cool, as ships with a combined capacity of 254,000 TEU have been ordered in the past six weeks. Of these, 15 are ultra large container ships in the region of 13,780-19,200 TEU and 12 are small feeders, with an average size of 1,327 TEU. The size trend in orderings has become even more explicit and it continues what we have seen throughout the year. In spite of the recent ordering flurry, year-to-date contracting activity amounts to 828,000 TEU; a significant improvement to the full year new orderings of 2013 at 2.1 million TEU.
Postponements during in recent months provide a beacon of hope. Amongst other ships, 10 ULCS originally scheduled for delivery in 2014 have been postponed to 2015. This has reduced the market pressure from newbuildings delivered this year further – still high, but eased by the impressive demolition activity. This hectic postponement activity has caused us to adjust our postponement assumptions from 10% to 15%, as owners and investors realize that too many orders delivered too soon cannot be absorbed by the market without a considerable negative impact. Looking ahead, BIMCO estimates a four-year-high fleet growth level for 2015, as long as the delivery of newbuildings keeps surging while demolition is set to ease off.
OUTLOOK
The past two months have once again proved that freight rates on container trades move in mysterious ways. What seems like a trend turns out to be anything but, and what seems to be industry knowing exactly how much supply is needed to make the best out of a strong demand side, pushes it too far.
The market is now past the peak season and supply management is as high as ever on the agenda for an industry being characterized by a full focus on cost cutting initiatives as it strives to restore profitability. The companies toughest on costs and the ones with the most efficient ways to operate their business networks and exploit the economies of scale offered by the market, will come out on top.
Alliances and extensive vessel sharing agreements are now completely dominating all trades in the industry. No single liner company can reach the next level of operational excellence on its own. Time will tell if all the initiatives and subsequent money saved will end up in the Profit/Loss statements of the liner companies. Or whether their customers are able to negotiate their share of the savings.
A factor in the future market that may not seem that significant today can have a large impact on the future exports of manufactured goods. The market today is dominated by China, a nation which will still be the dominant player going forward – but not undisputedly. Higher wage costs in China that producers are unable to pass on to consumers are set to bring to life other and cheaper manufacturing centers. Pushing that development forward is also the 30% rise in the Chinese Renminbi against the USD over the past decade, as Beijing slowly allows the Renminbi to appreciate. Indonesia, Bangladesh and Myanmar are on the rise and China may lend them an unexpected hand.
---
Source: https://www.bimco.org